![]()
The Mike Downs Center for Indiana Politics has contracted with SurveyUSA to conduct a poll in Indiana’s third congressional district.
The press release:
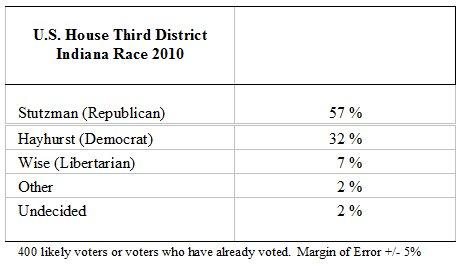
Democrat Tom Hayhurst trails Republican Marlin Stutzman significantly among likely and early voters in Indiana’s third congressional district. Stutzman has the support of a majority of voters in every single demographic category except for those who have a graduate education (Stutzman 47% Hayhurst 46%) and among those who go to church three-to-four times a year (tied at 46%). These two groups, along with people who go to church once or twice a month, are the only demographic groups where Hayhurst reaches 40%. Even among voters who have been important sources of Democratic support in recent American election cycles, Stutzman polls very well. Among women, he leads Hayhurst 54% to 34% and among voters 18-34 and 35-49, where he receives 62% support among likely or early voters.
About the Mike Downs Center for Indiana Politics
The Mike Downs Center for Indiana Politics is a non-partisan organization that helps the people of Indiana understand the role of politics and government in their daily lives. By doing this, The Mike Downs Center hopes to encourage participation in political and public processes the same way its namesake Dr. Michael C. Downs did for more than 34 years. The Mike Downs Center is located on the campus of Indiana University-Purdue University Fort Wayne (IPFW).Statement of Methodology for U.S. House 3rd District of Indiana: SurveyUSA interviewed 565 registered voters from Indiana’s 3rd Congressional District 10/21/10 through 10/25/10, using Registration Based Sample (RBS) from Aristotle in Washington DC. Of the registered voters, 400 were determined by SurveyUSA to have already voted, or to be likely to vote in the 11/02/10 midterm election. Where necessary, responses were weighted according to the voter registration database. In theory, with the stated sample size, one can say with 95% certainty that the results would not vary by more than the stated margin of sampling error, in one direction or the other, had the entire universe of respondents been interviewed with complete accuracy. There are other possible sources of error in all surveys that may be more serious than theoretical calculations of sampling error. These include refusals to be interviewed, question wording and question order, weighting by demographic control data and the manner in which respondents are filtered (such as, determining who is a likely voter). It is difficult to quantify the errors that may result from these factors. Fieldwork for this survey was done by SurveyUSA of Clifton, NJ.

